Project Overview

Updating Analytics
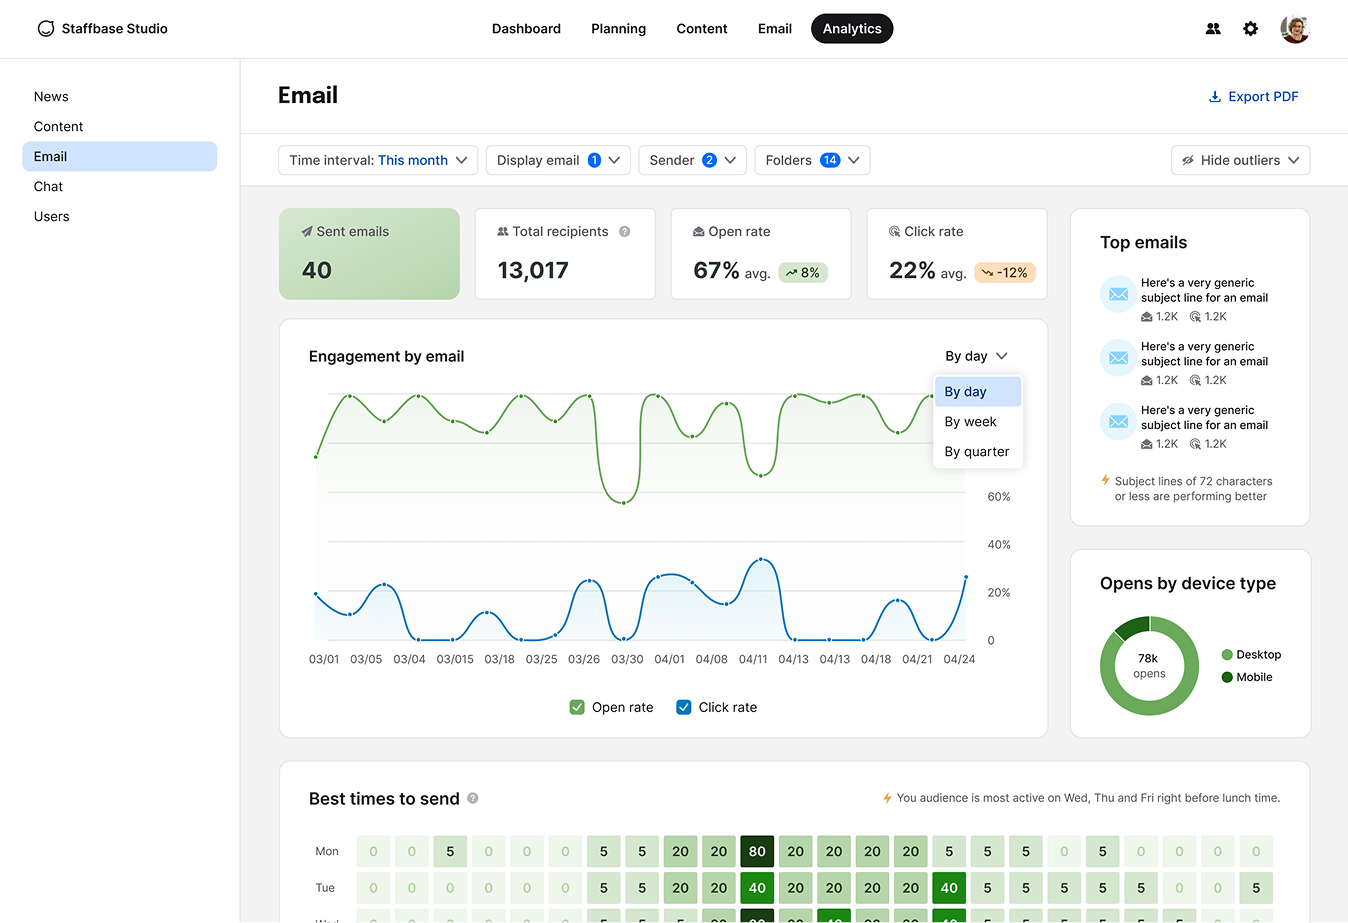
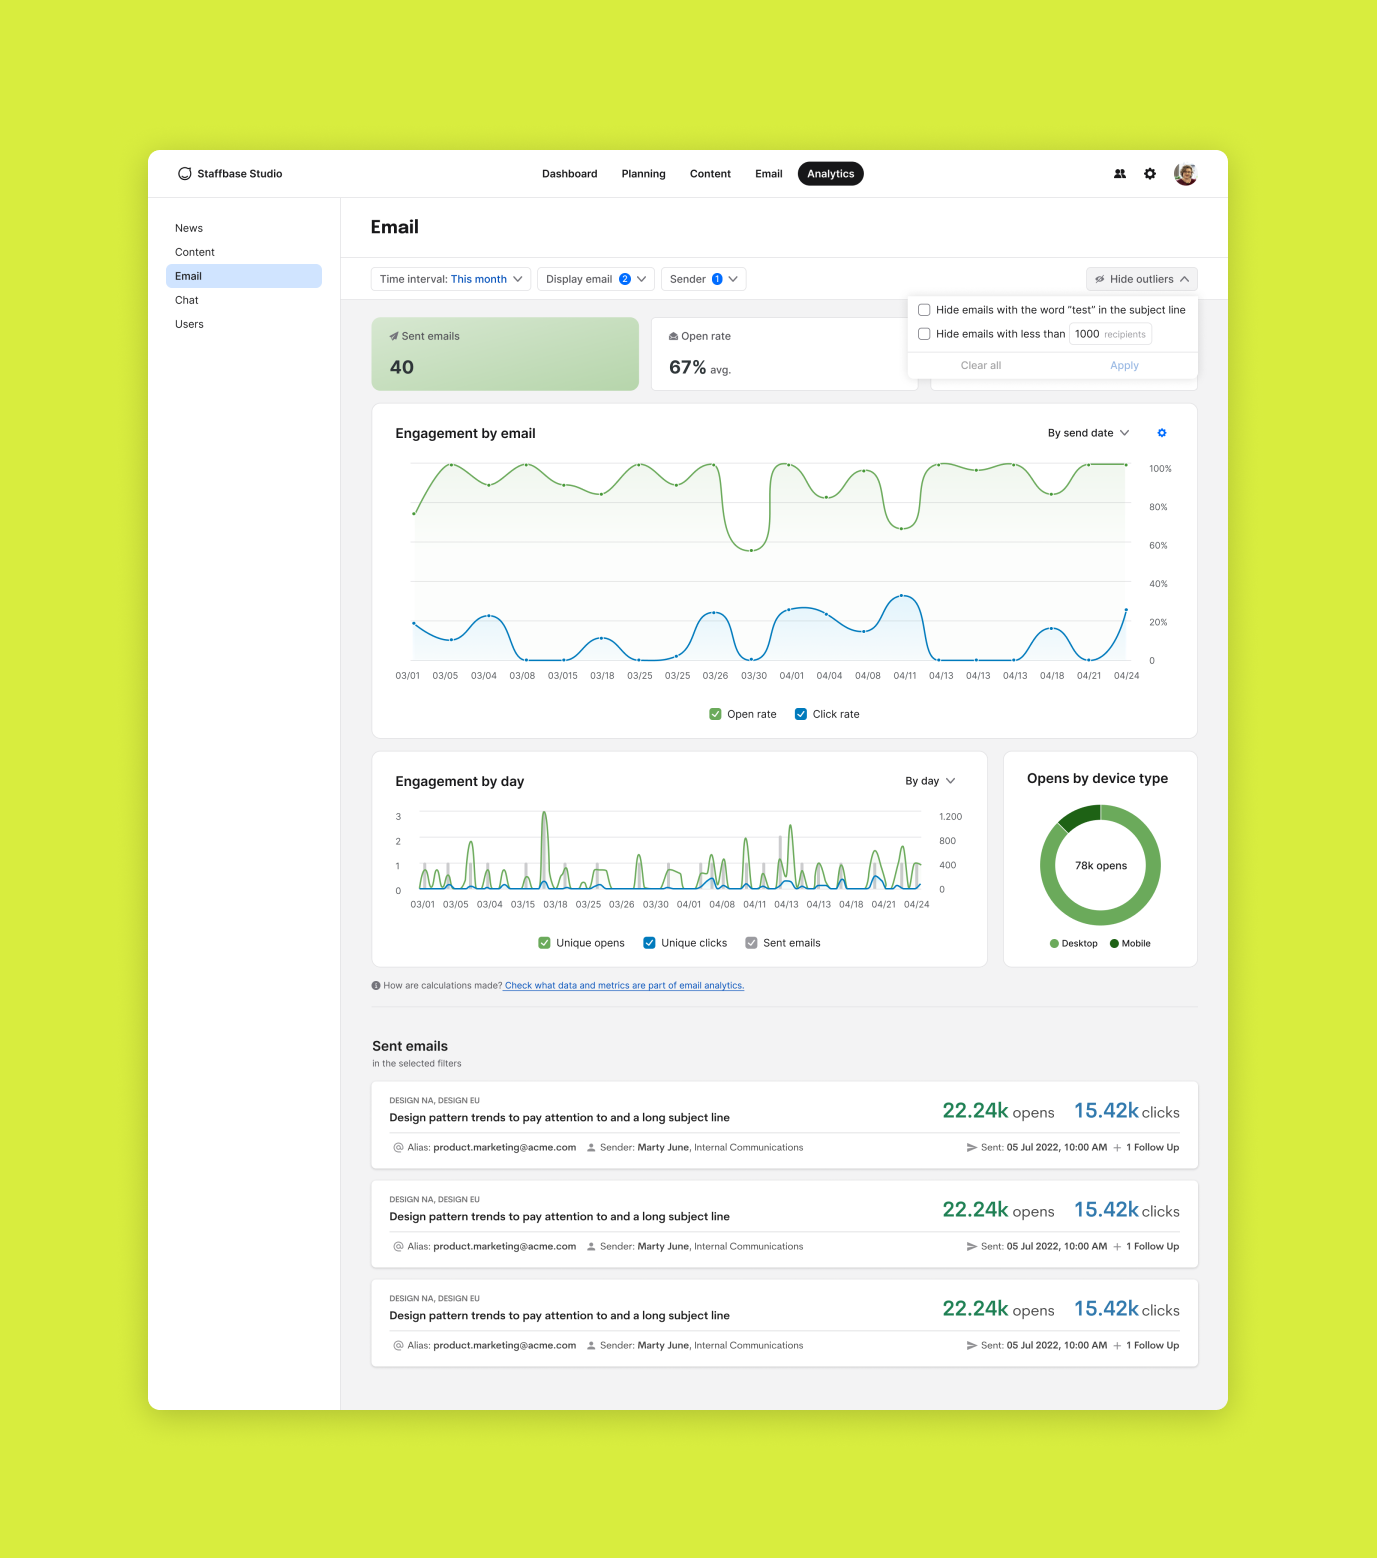
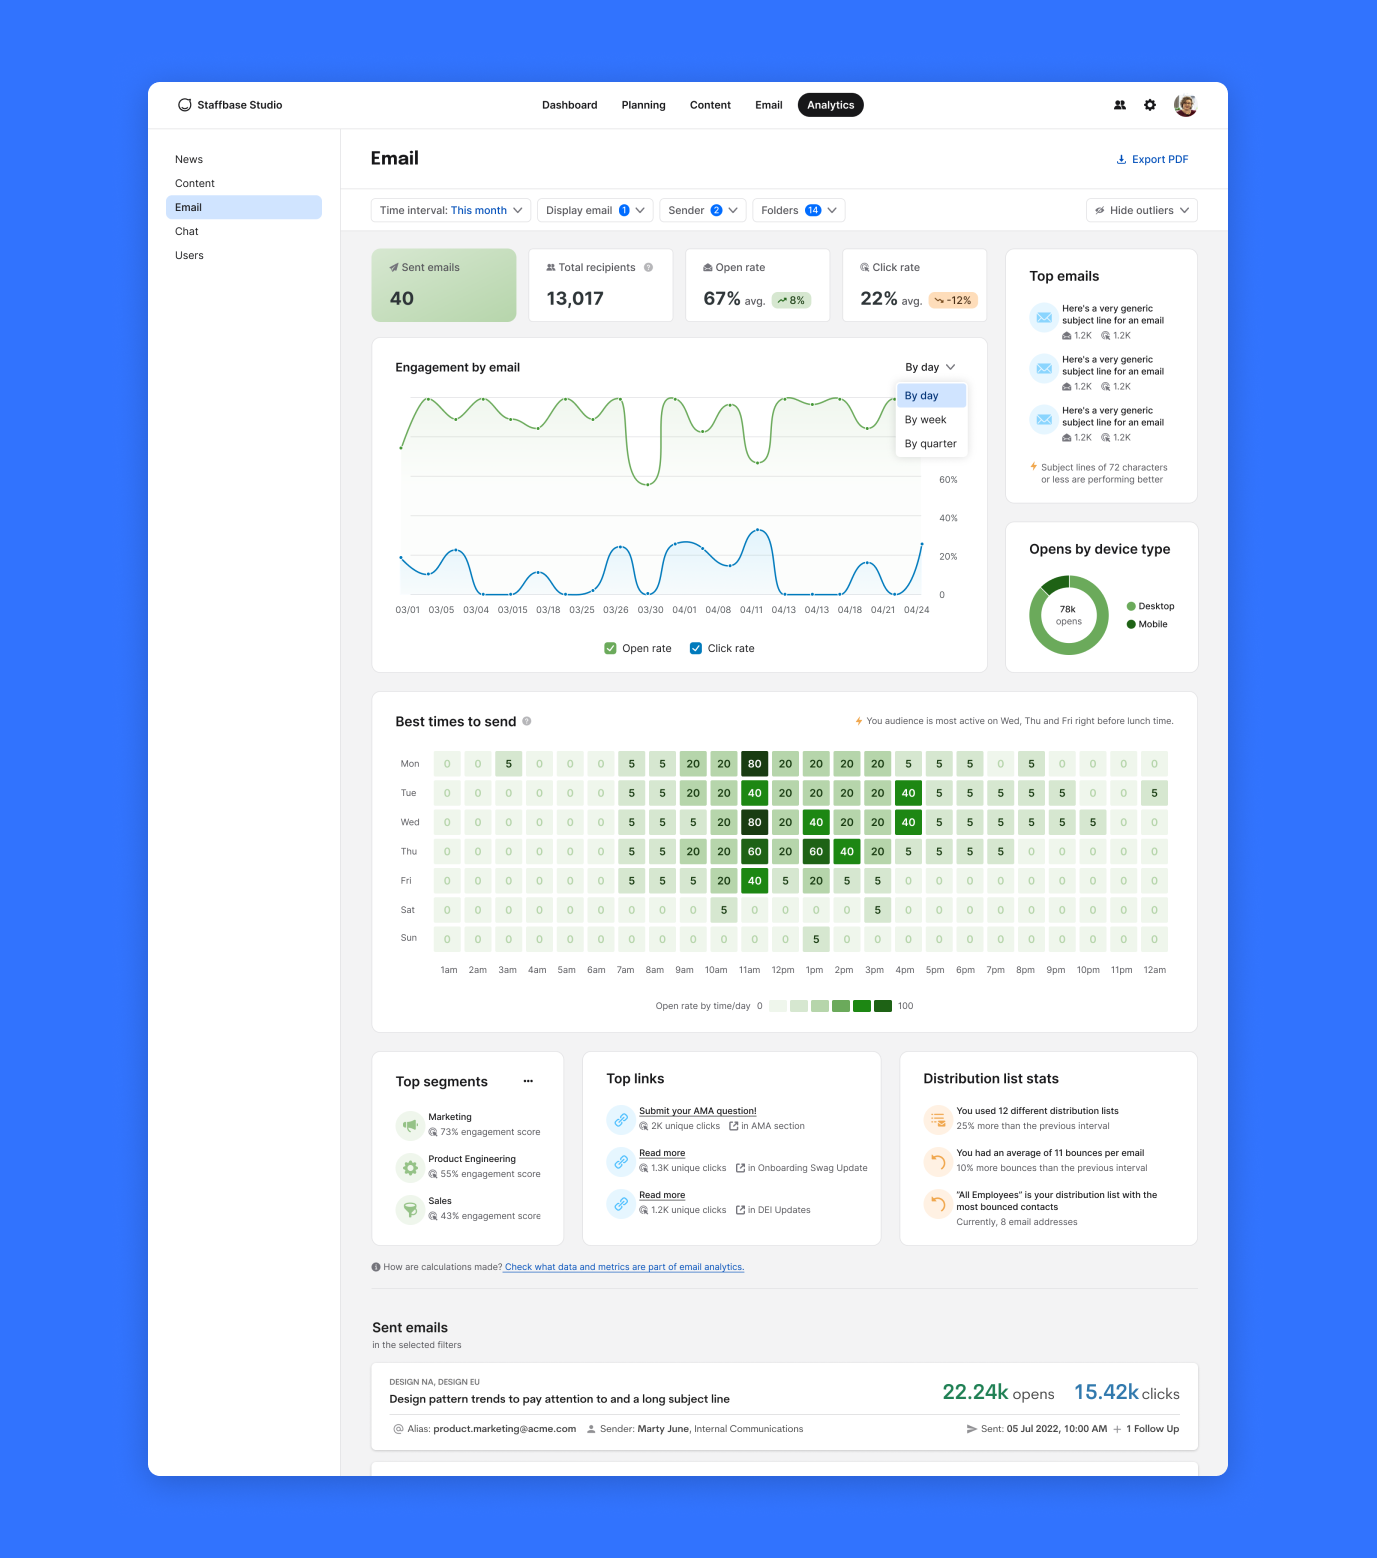
Analytics dashboard — email performance overview
COMPANY
Bananatag (Staffbase Email)
TEAM
2 designers, 1 PM, 5 engs
TIMELINE
2021-23

After discovering user pain points in Reports, we created a new Analytics Dashboard MVP. Follow up improvements were delayed after a diagnosis of tech debt. Eventually, priority increased again due to general bugs.

Problem

  • For communicators, identifying recent trends and planning short-term improvements for ongoing campaigns was complicated and decentralized.
  • For Bananatag, Customer Success was dedicating many hours to generating visual reports on Excel for specific customers.

Goal

To simplify access to email performance data and provide actionable insights.

My Role

I interviewed customer success and customers to understand what were the pain points in the original solution. I audited the existing reports, and shared insights with PM and technical team, and we collaborated to design the crew vision and roadmap. With that in place, I collaborated with a younger designer on quick wins (report improvements), and led the query builder redesign and creation of the full dashboard view.

What Shipped

  • Improved UX for empty states and delete flows.
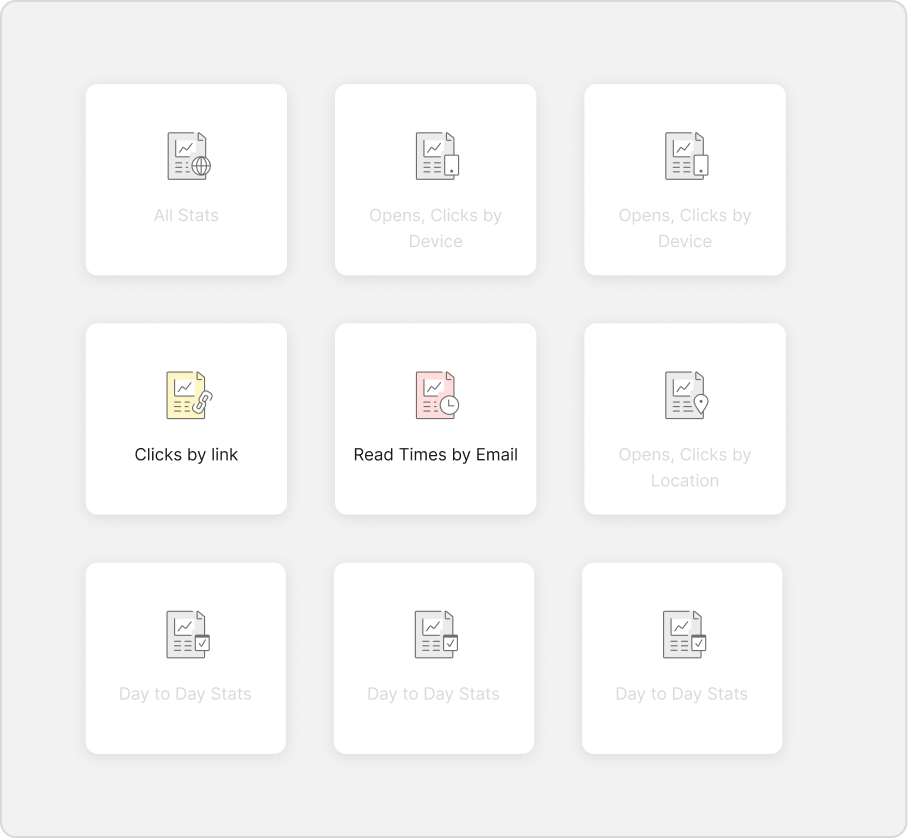
  • New set report templates by metrics.
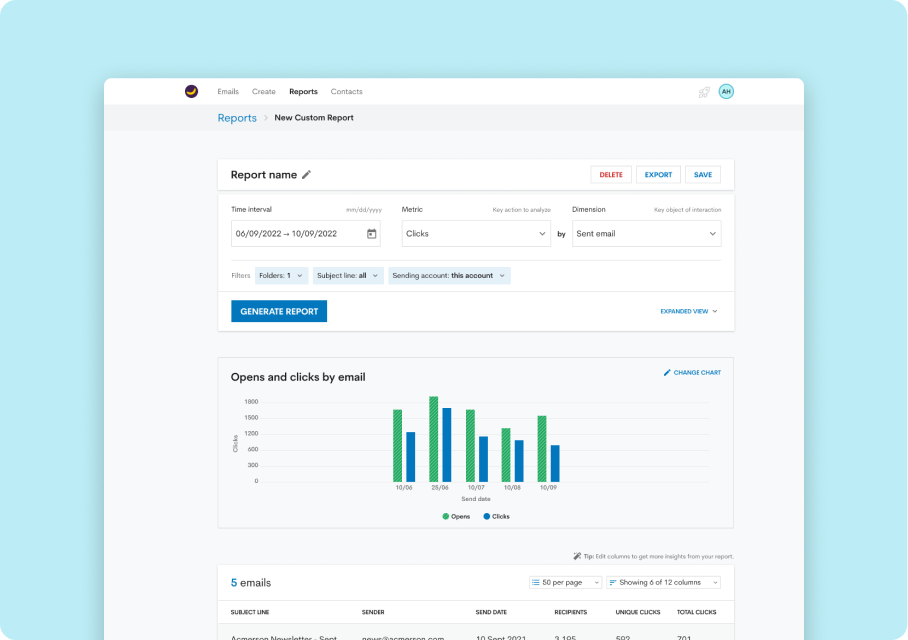
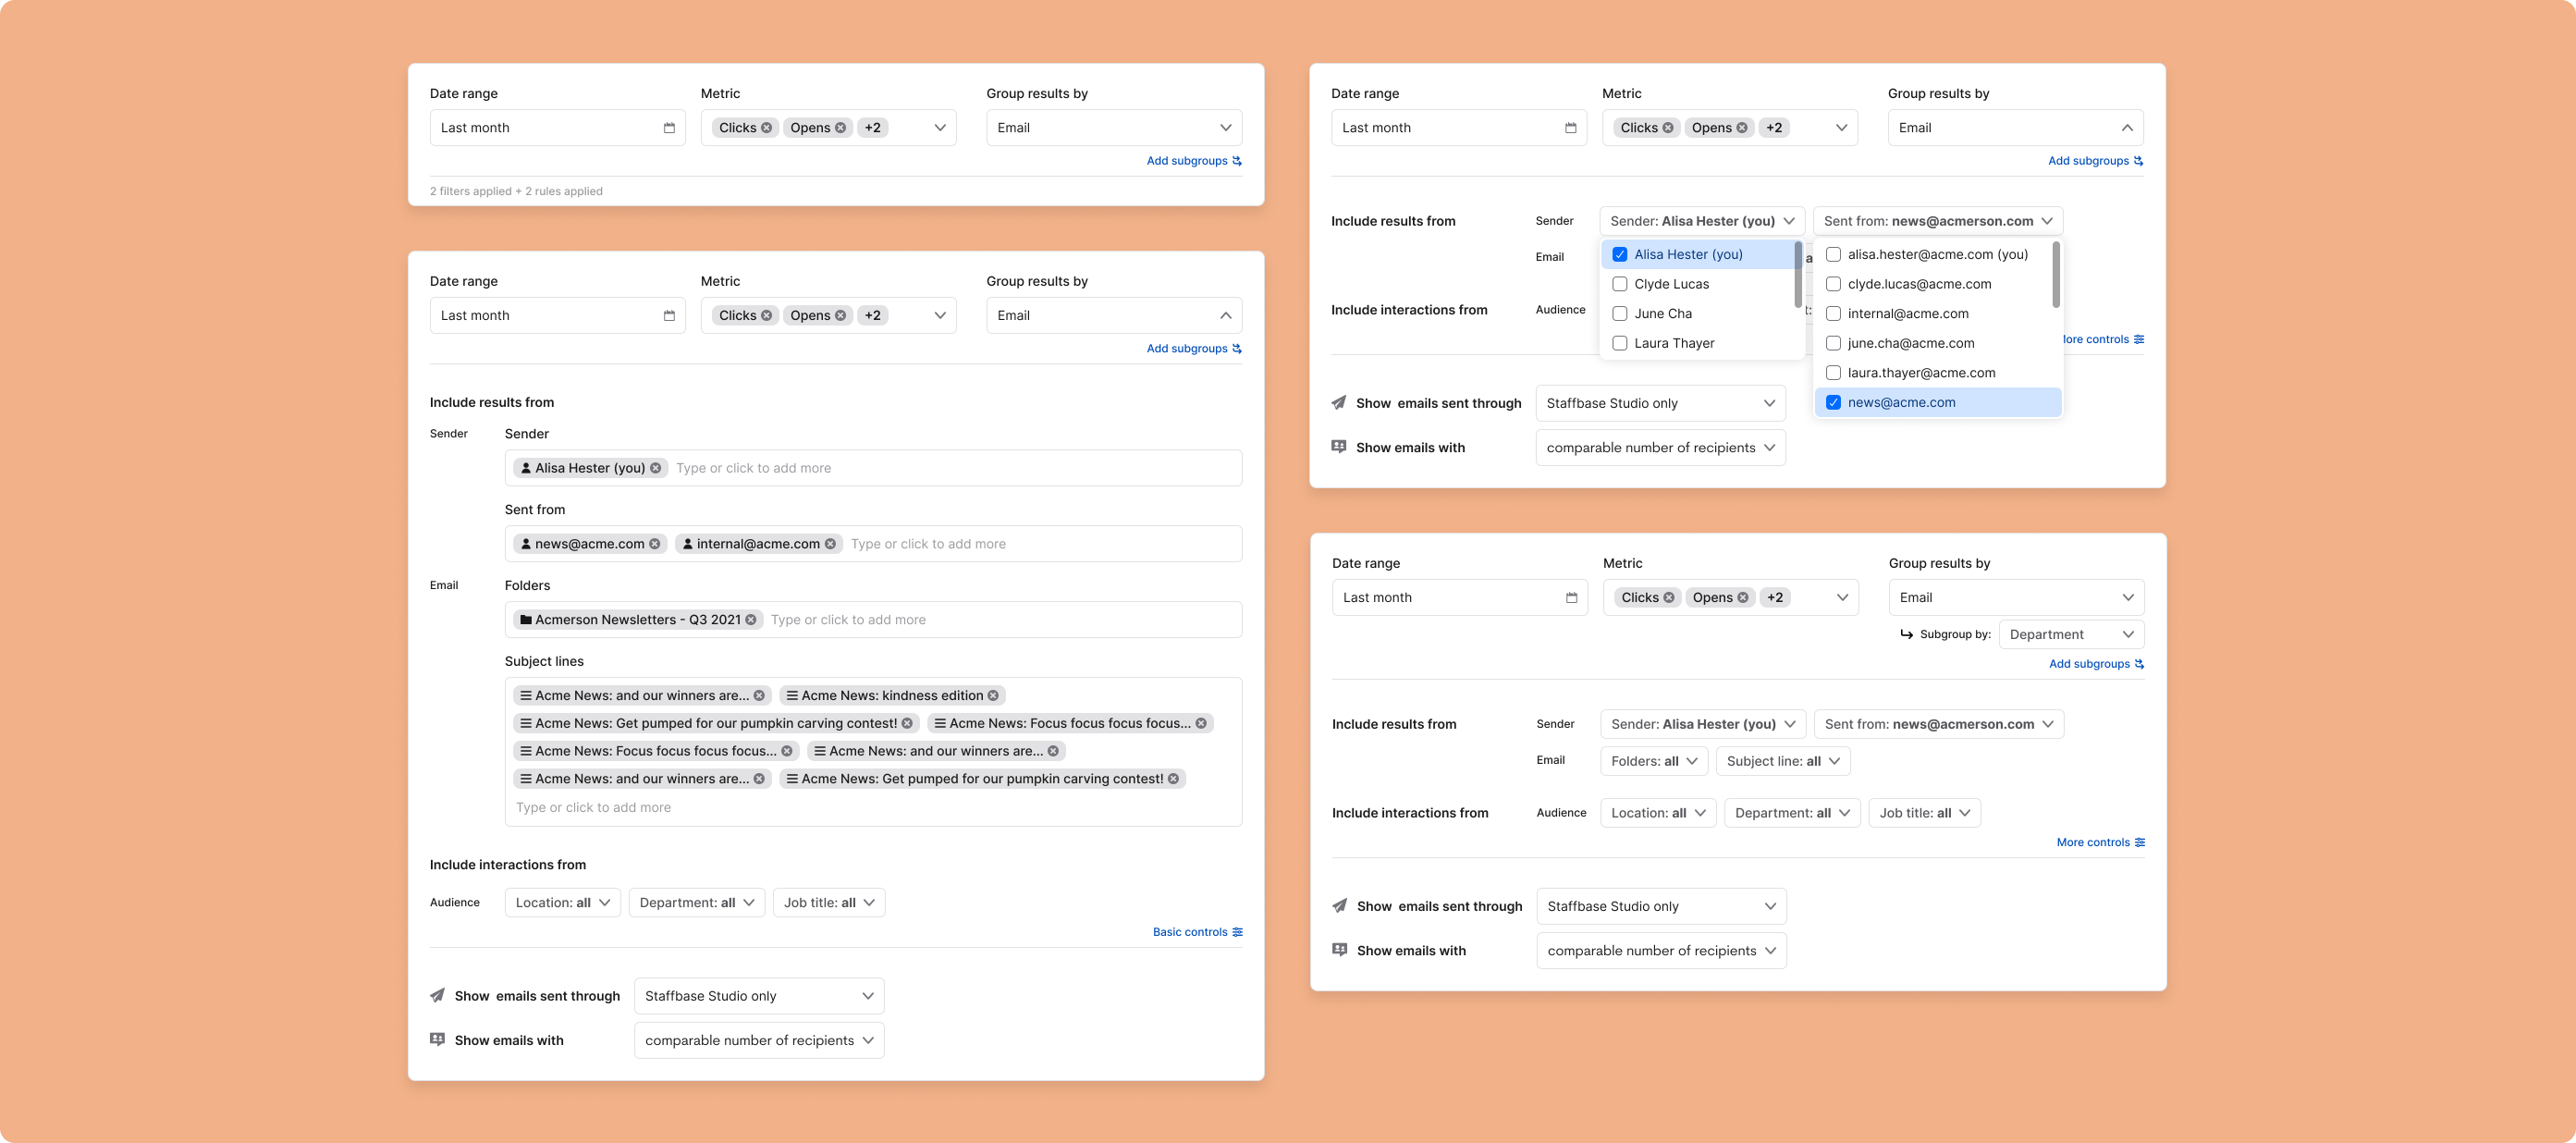
  • Updated query builder controls.
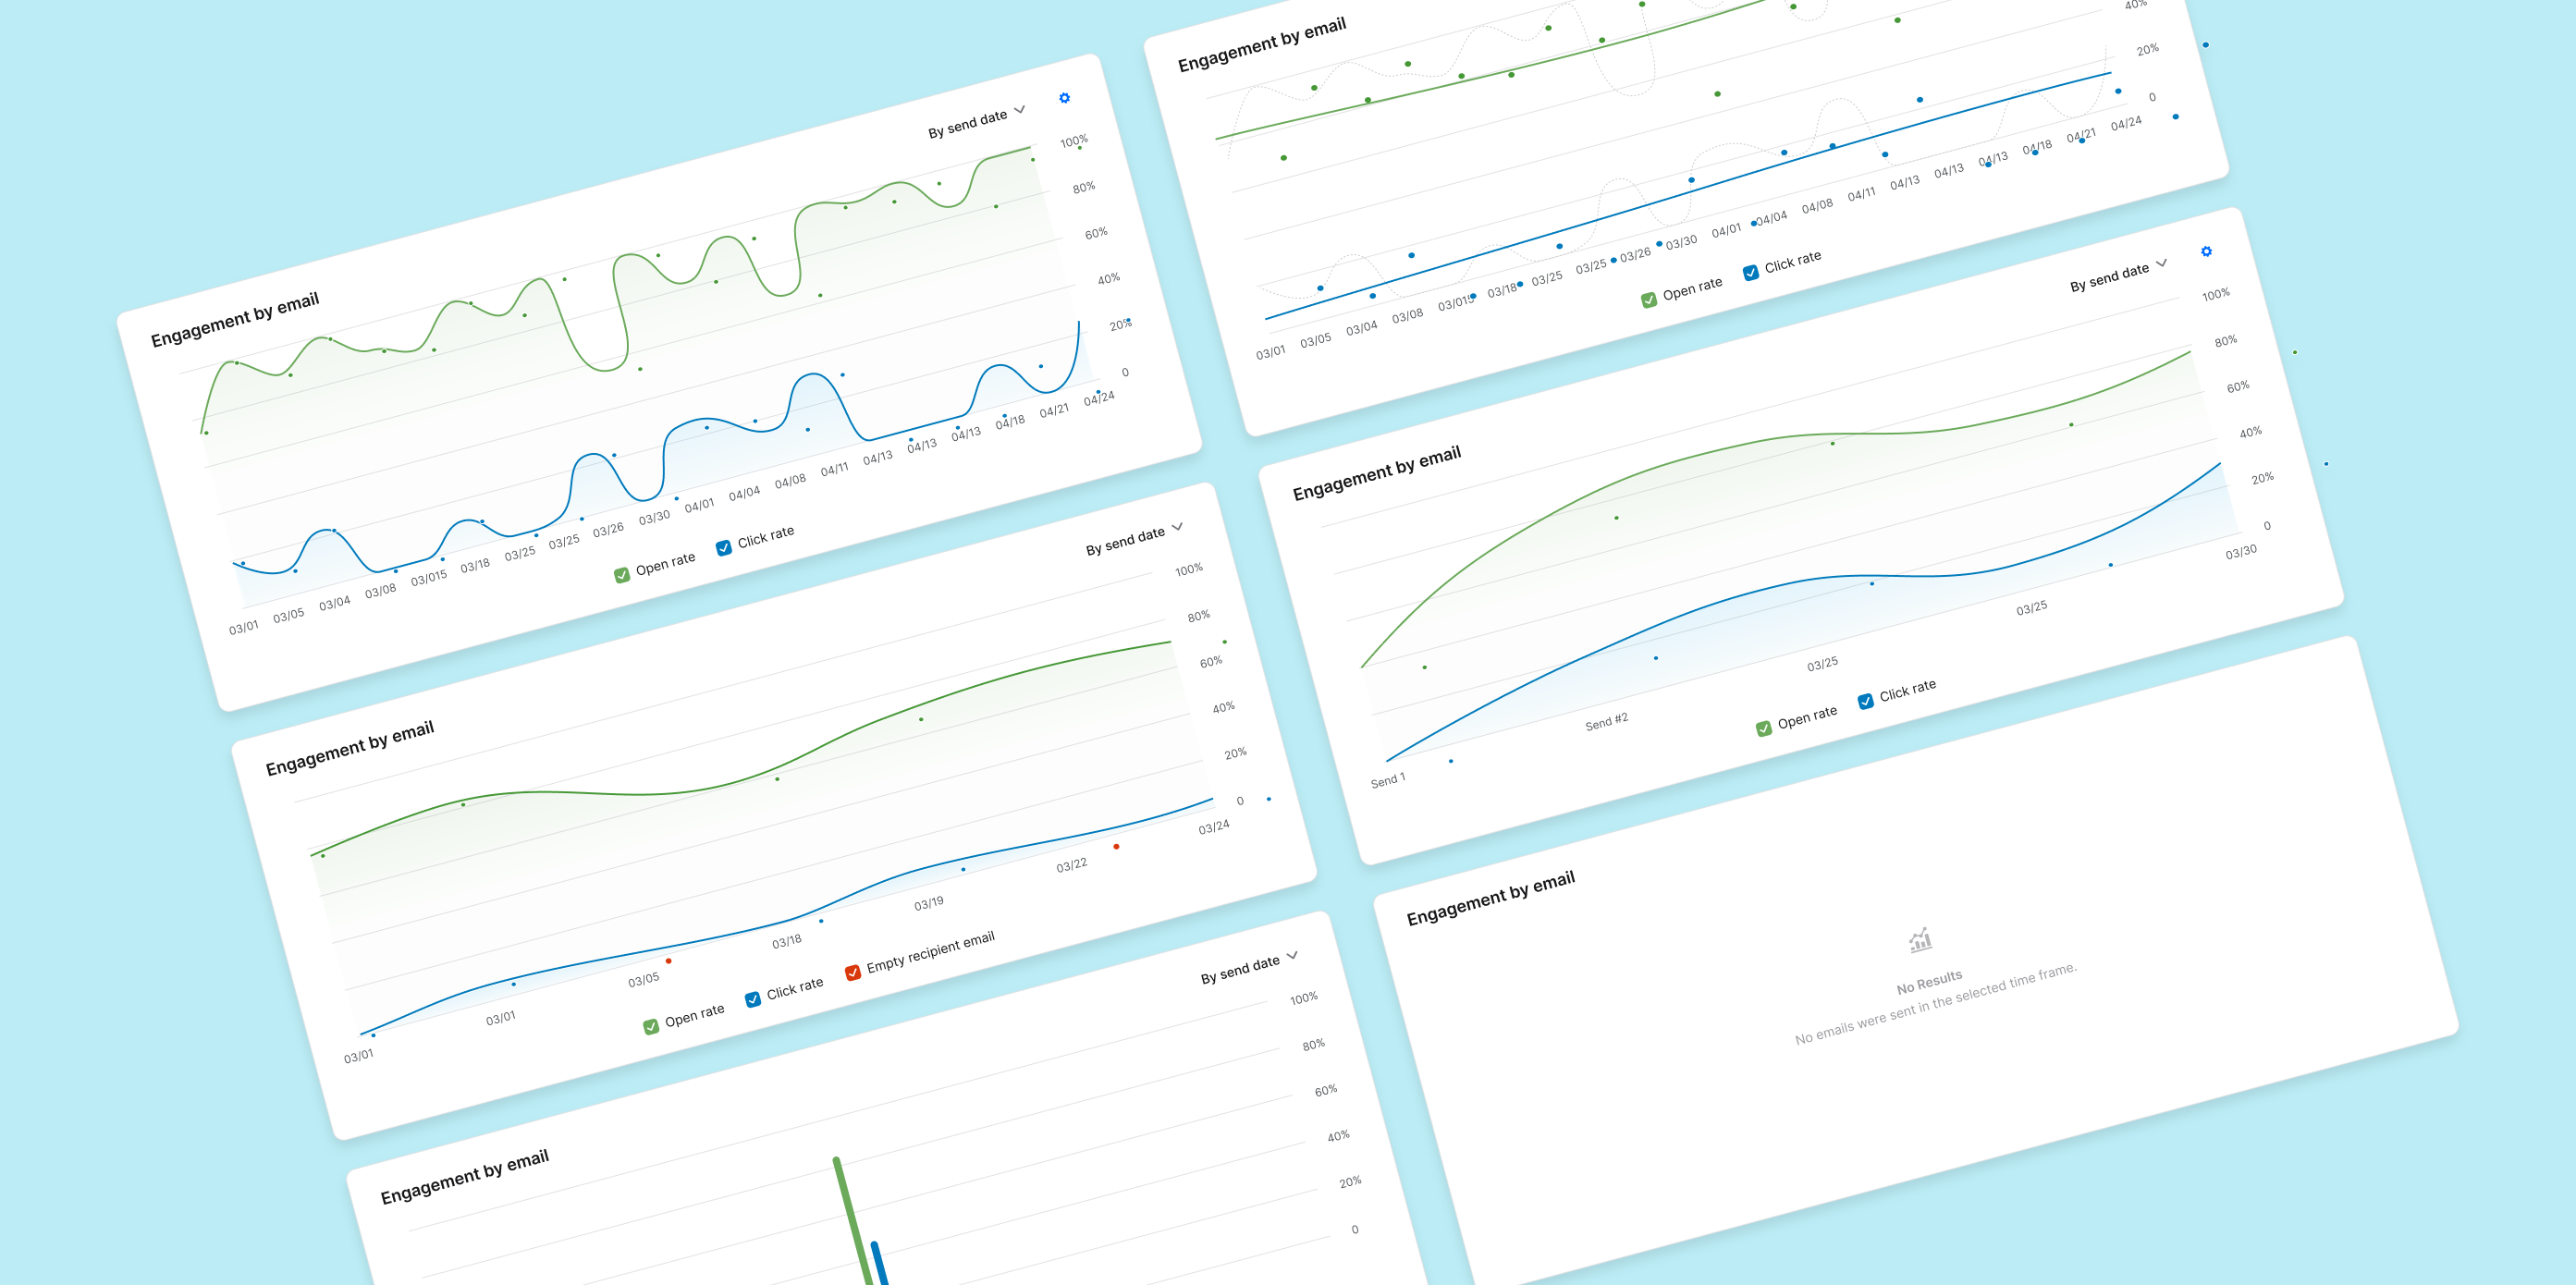
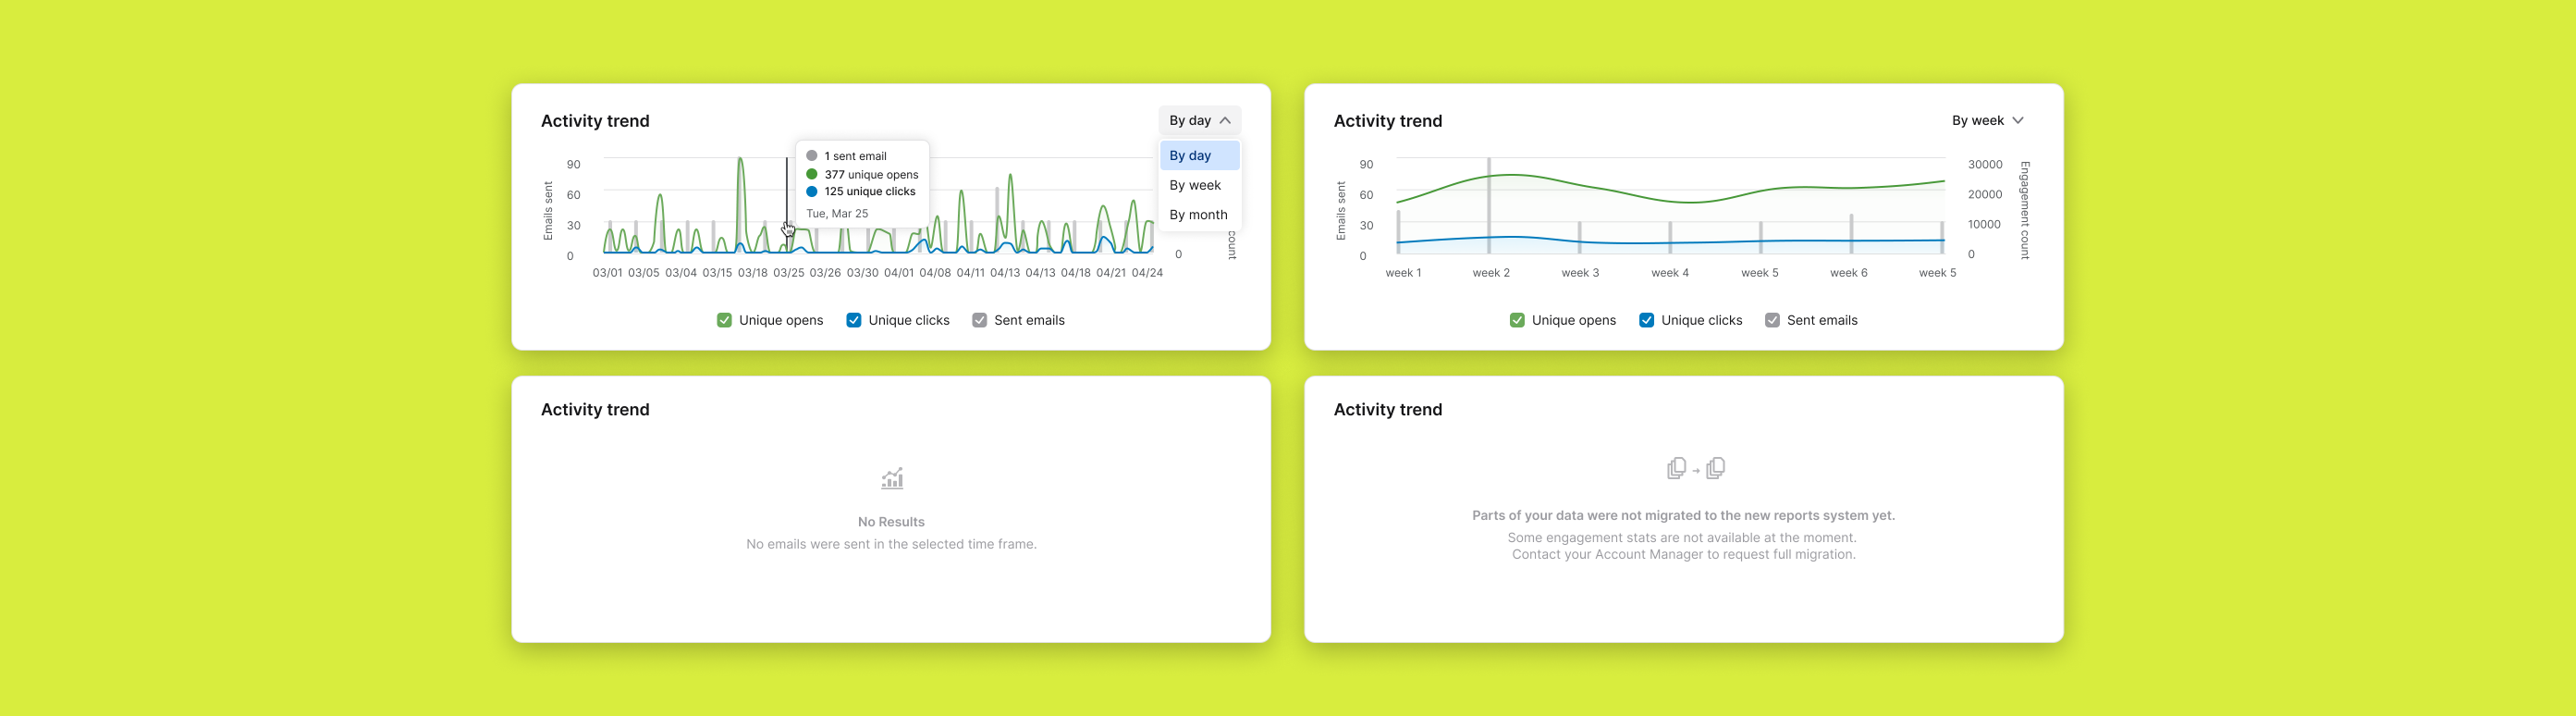
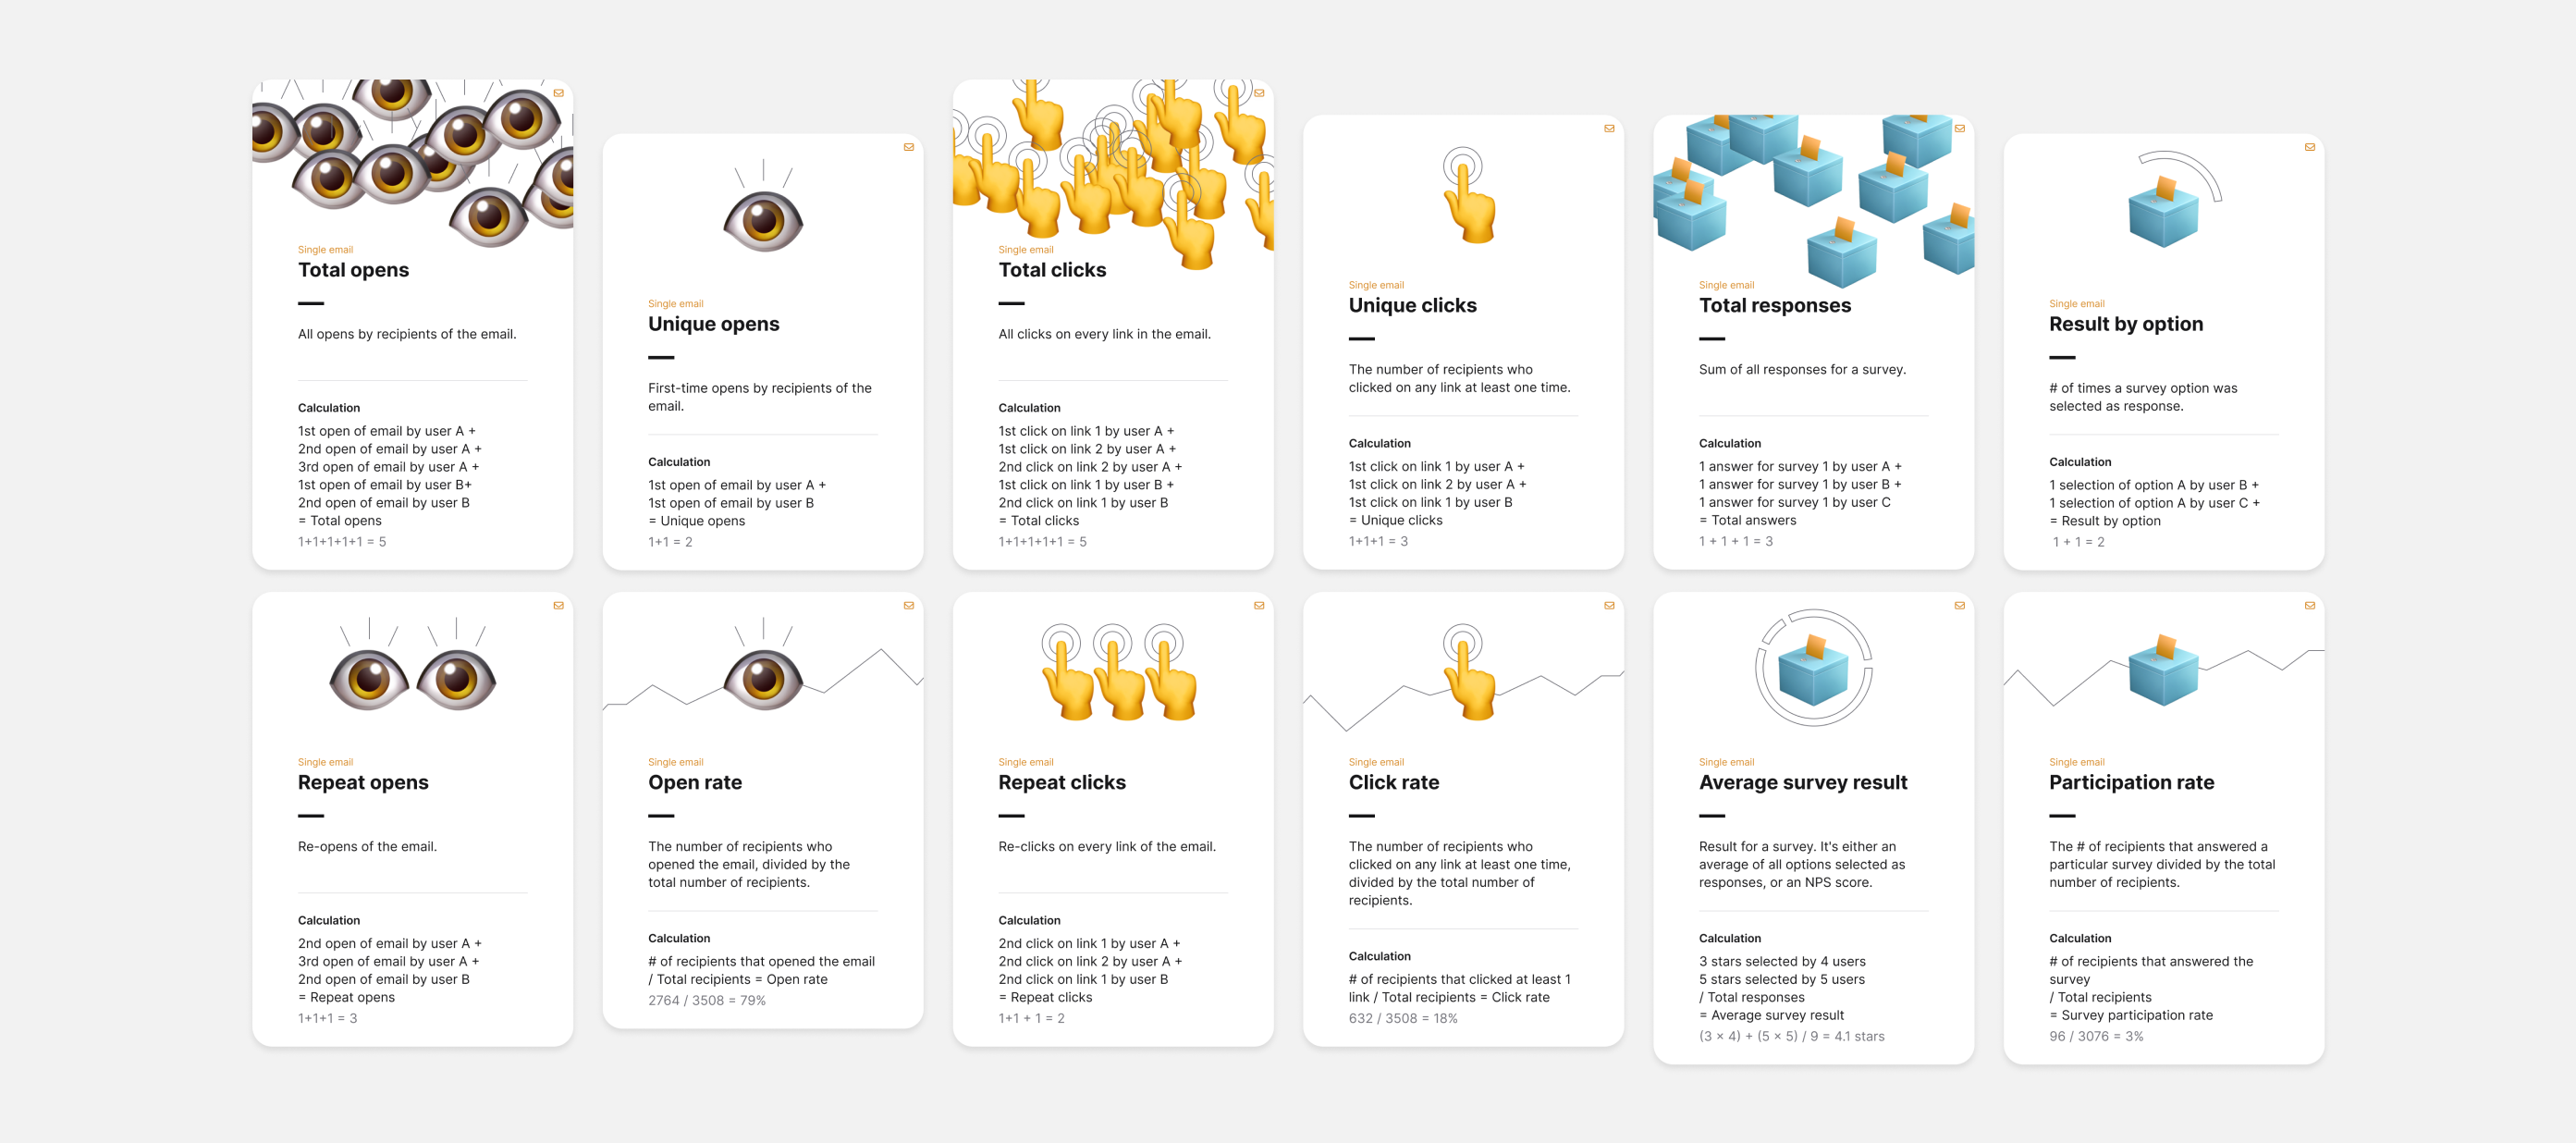
  • Design documentation for specific data visualization for different metrics.

Results

  • 2 new templates have become the most used metric-specific reports.
  • Internally, we have helped establish a set of visualizations adequate to show email performance.

Favorite Learning

Accessibility beyond colors: how to use patterns on charts, accessible date pickers and keyboard navigation.
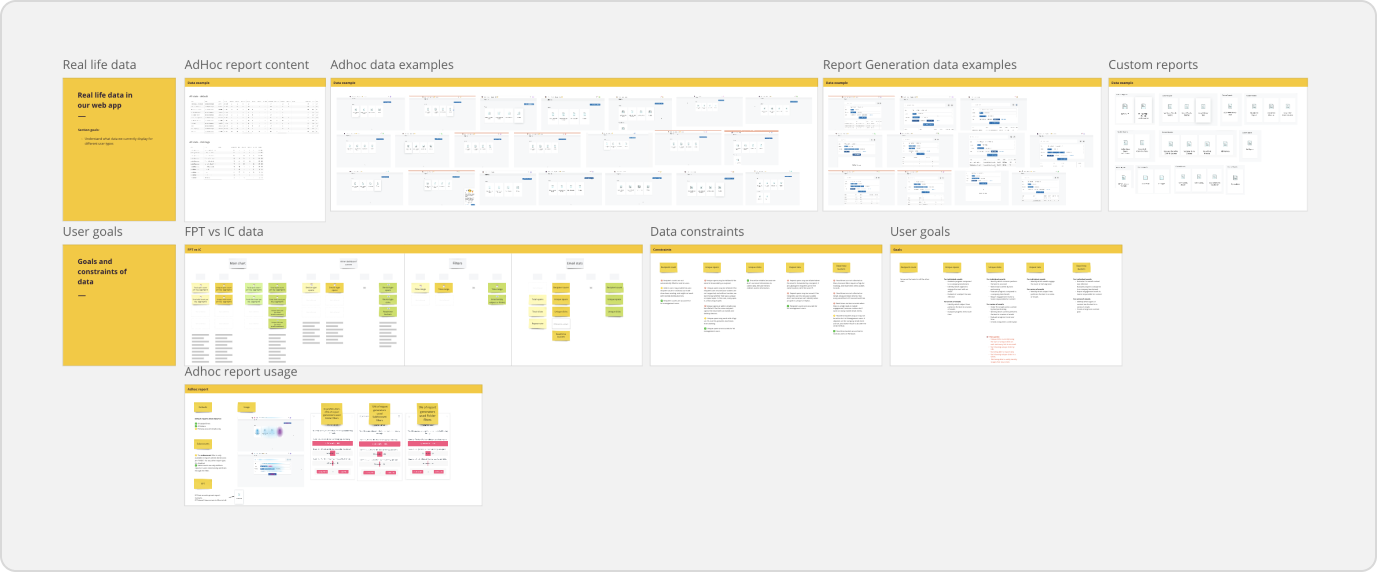
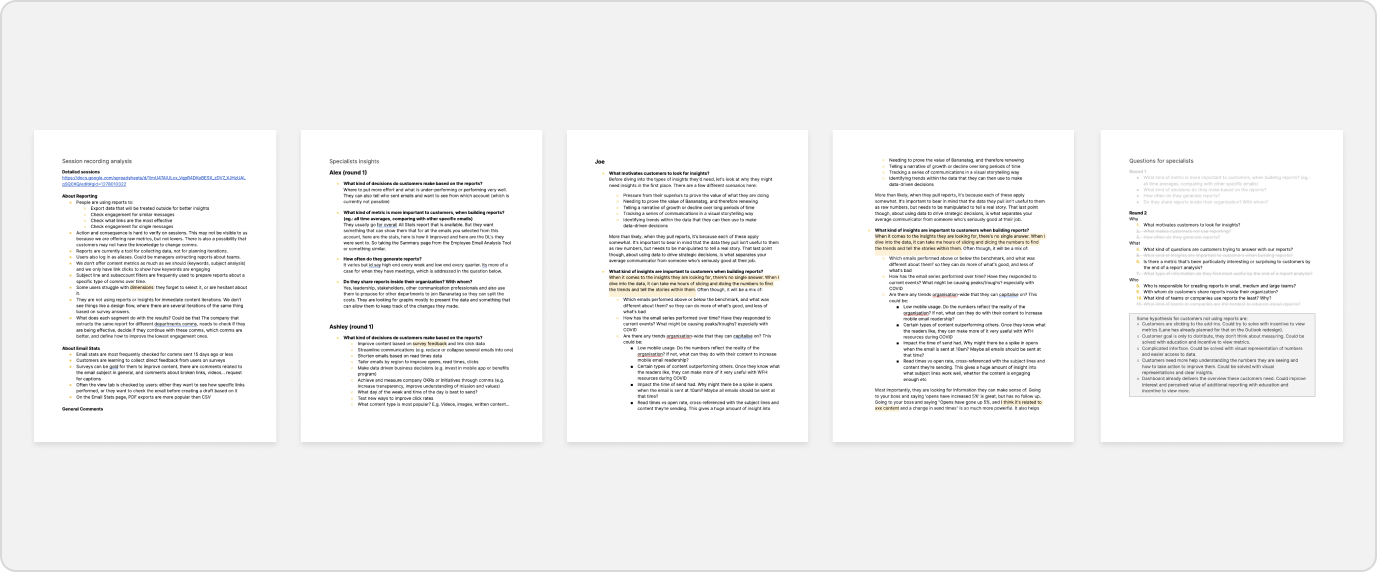
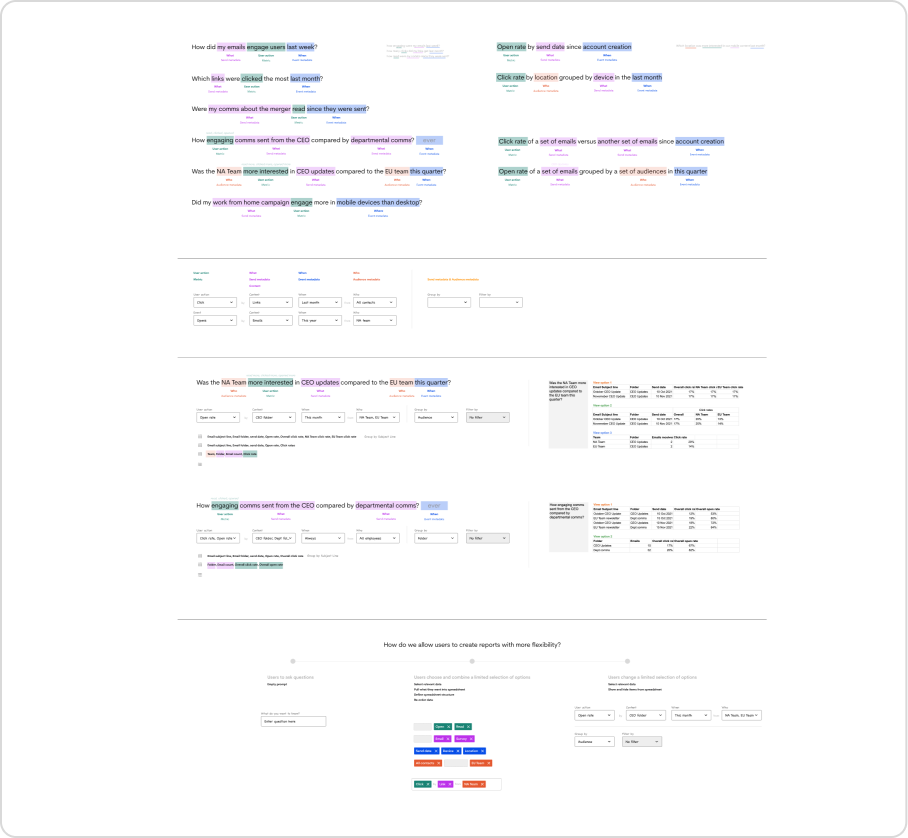
Collaborative board for documenting findings.
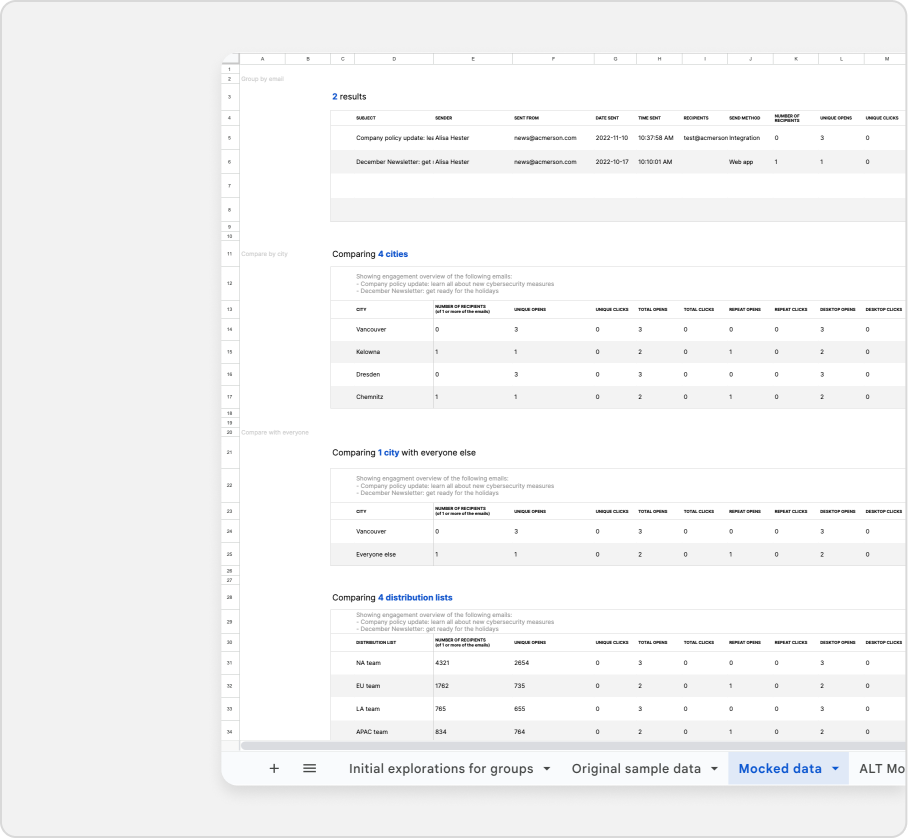
Notes from discovery calls.
Breaking down report elements.
Planning the display of new report combinations.
New templates.
New templates.
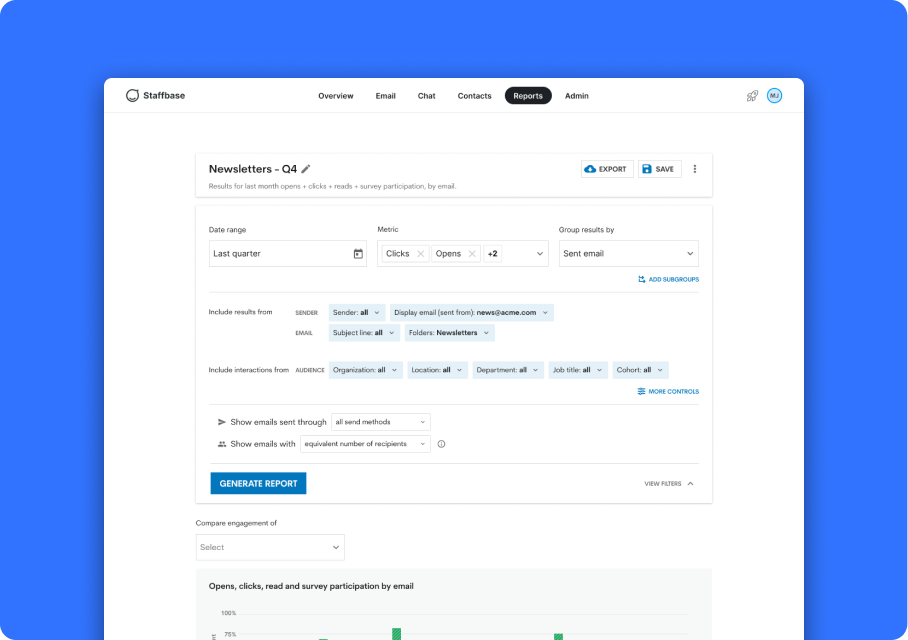
2021: improvements on a legacy UI.
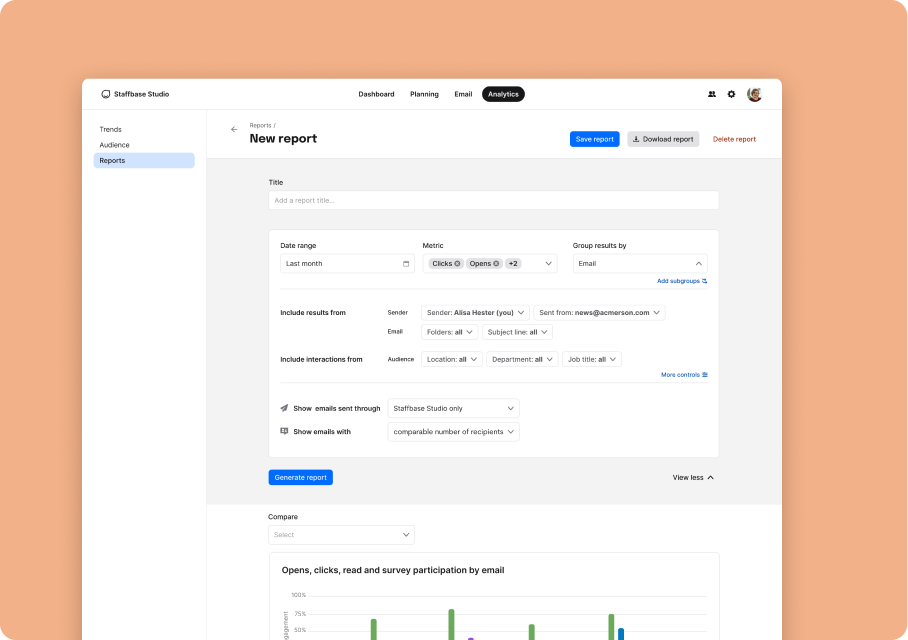
2022: additional changes for a platform ongoing rebrand.
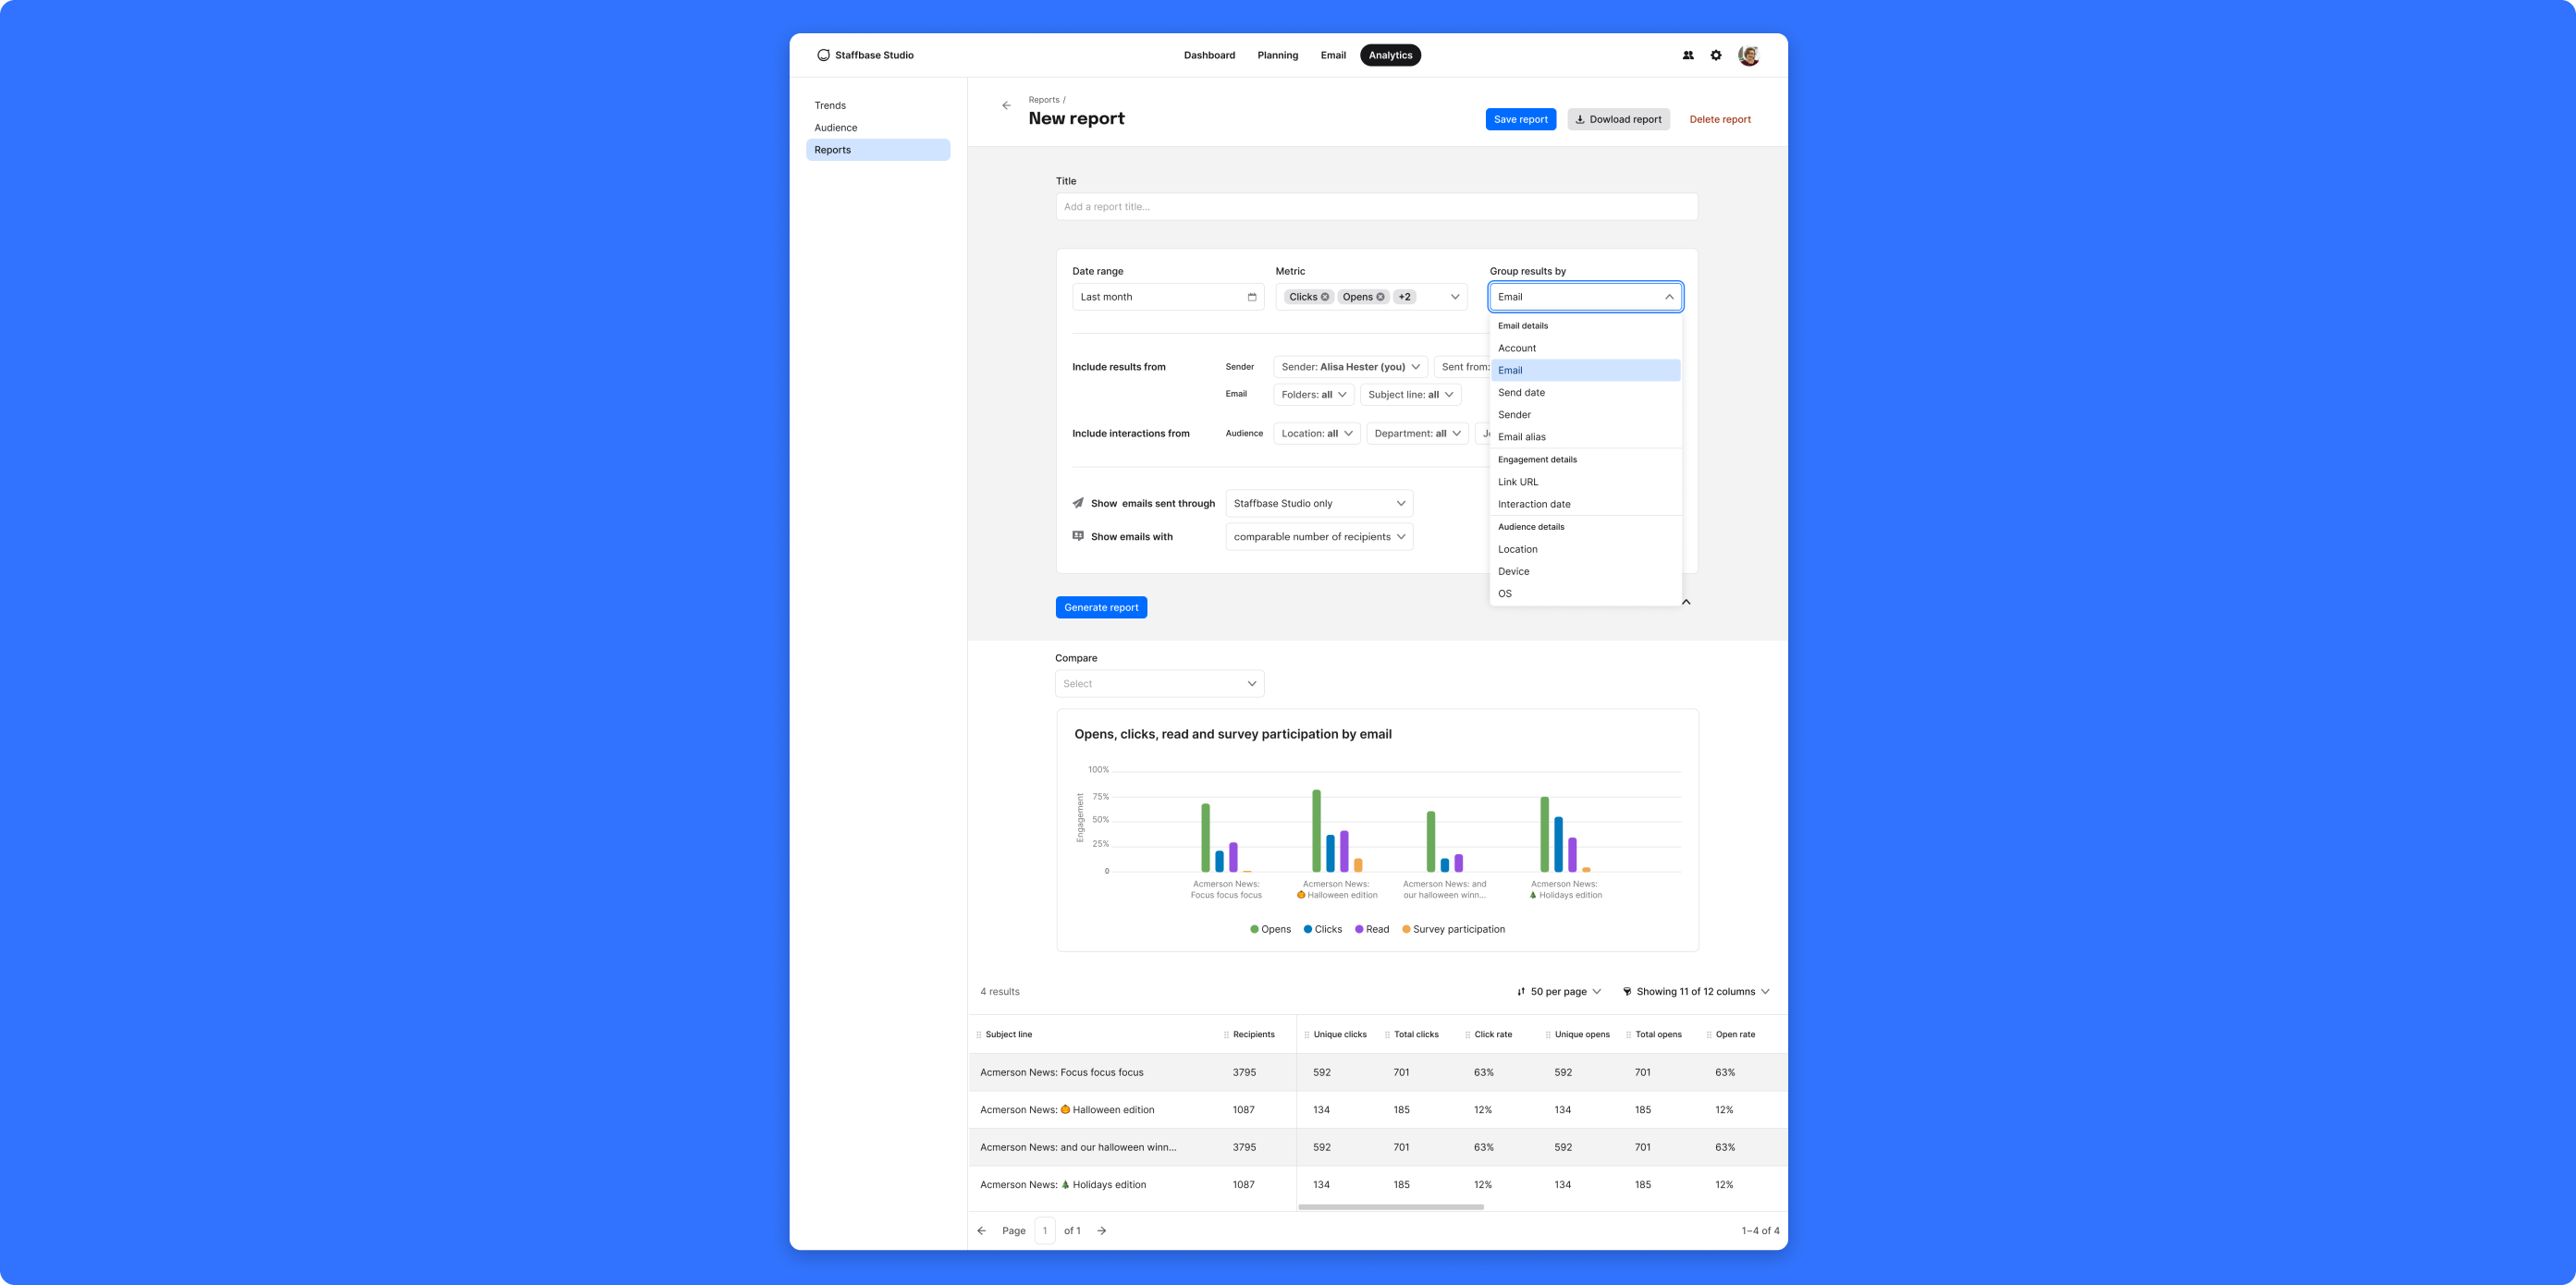
2023: new UI in a combined product.
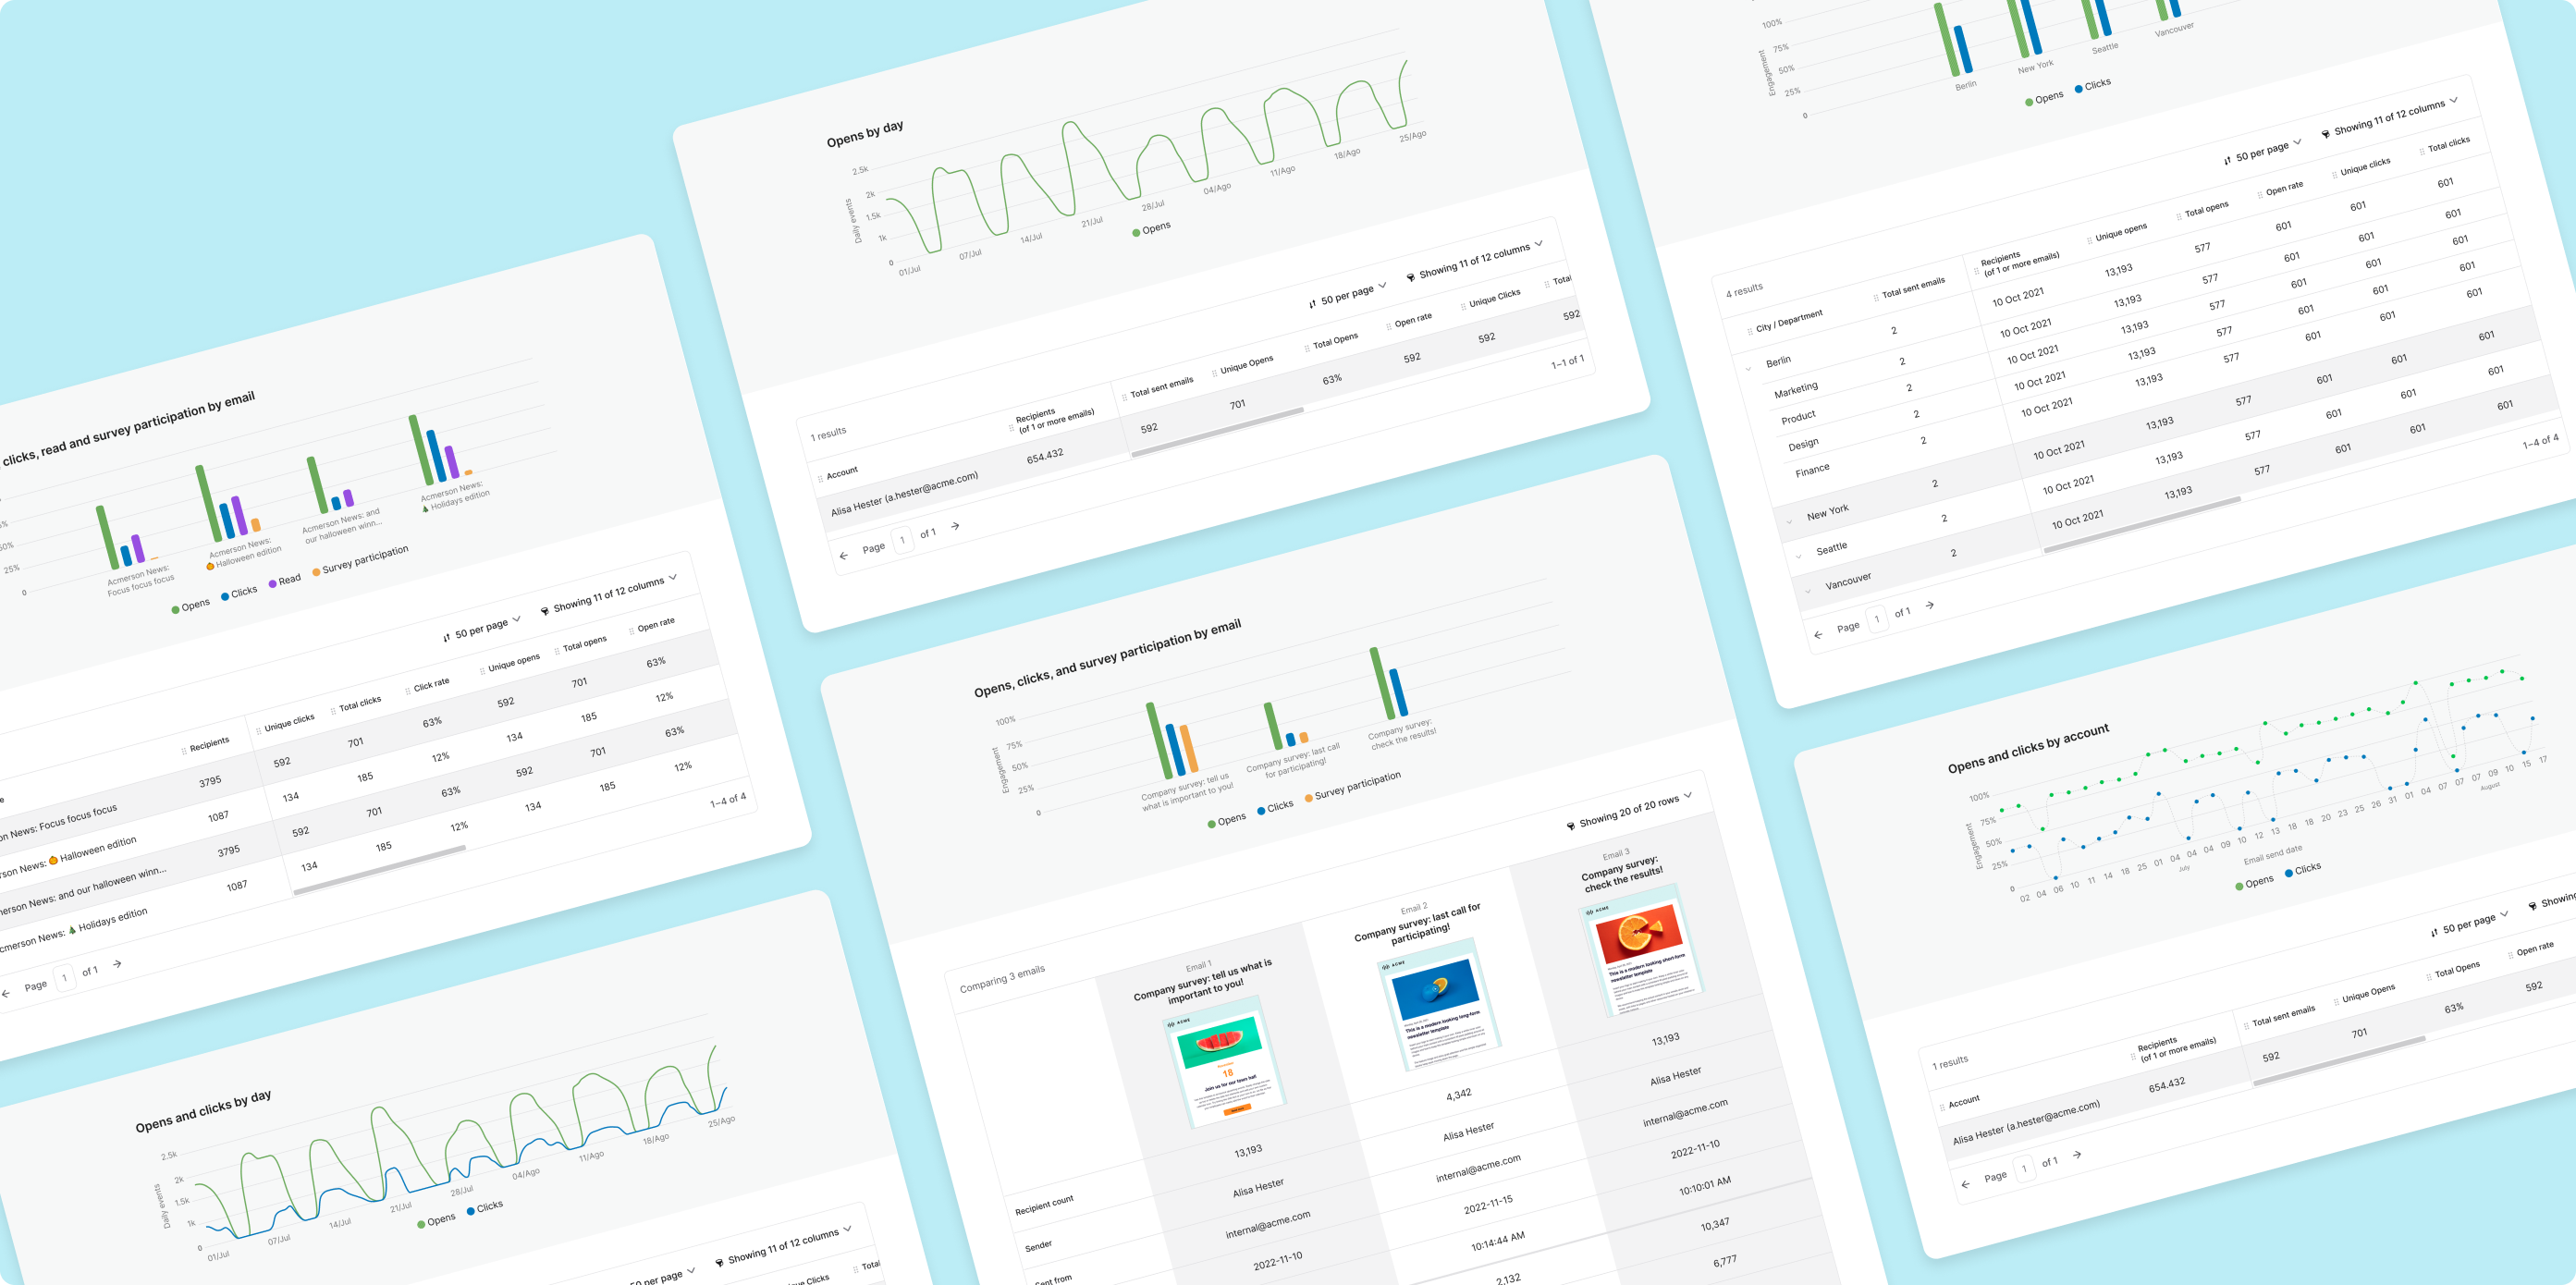
Multiple outputs: different report types based on the data setup.
Report generator states in Staffbase UI style.
Lo-fi wireframes for content mapping.
Progression of hi-fi explorations.
First release: additional filters with simpler content.
End-goal: enhanced visualizations and new insights.
Multiple outputs: different report types based on the data setup.
Report generator states
Calculations explained and detailed.

Need more details?

Email me for a full case study walkthrough: